Adding Loki Datasource in Grafana
Follow these steps to add a Loki datasource in Grafana. This will enable you to integrate Loki for log visualization alongside your metrics.
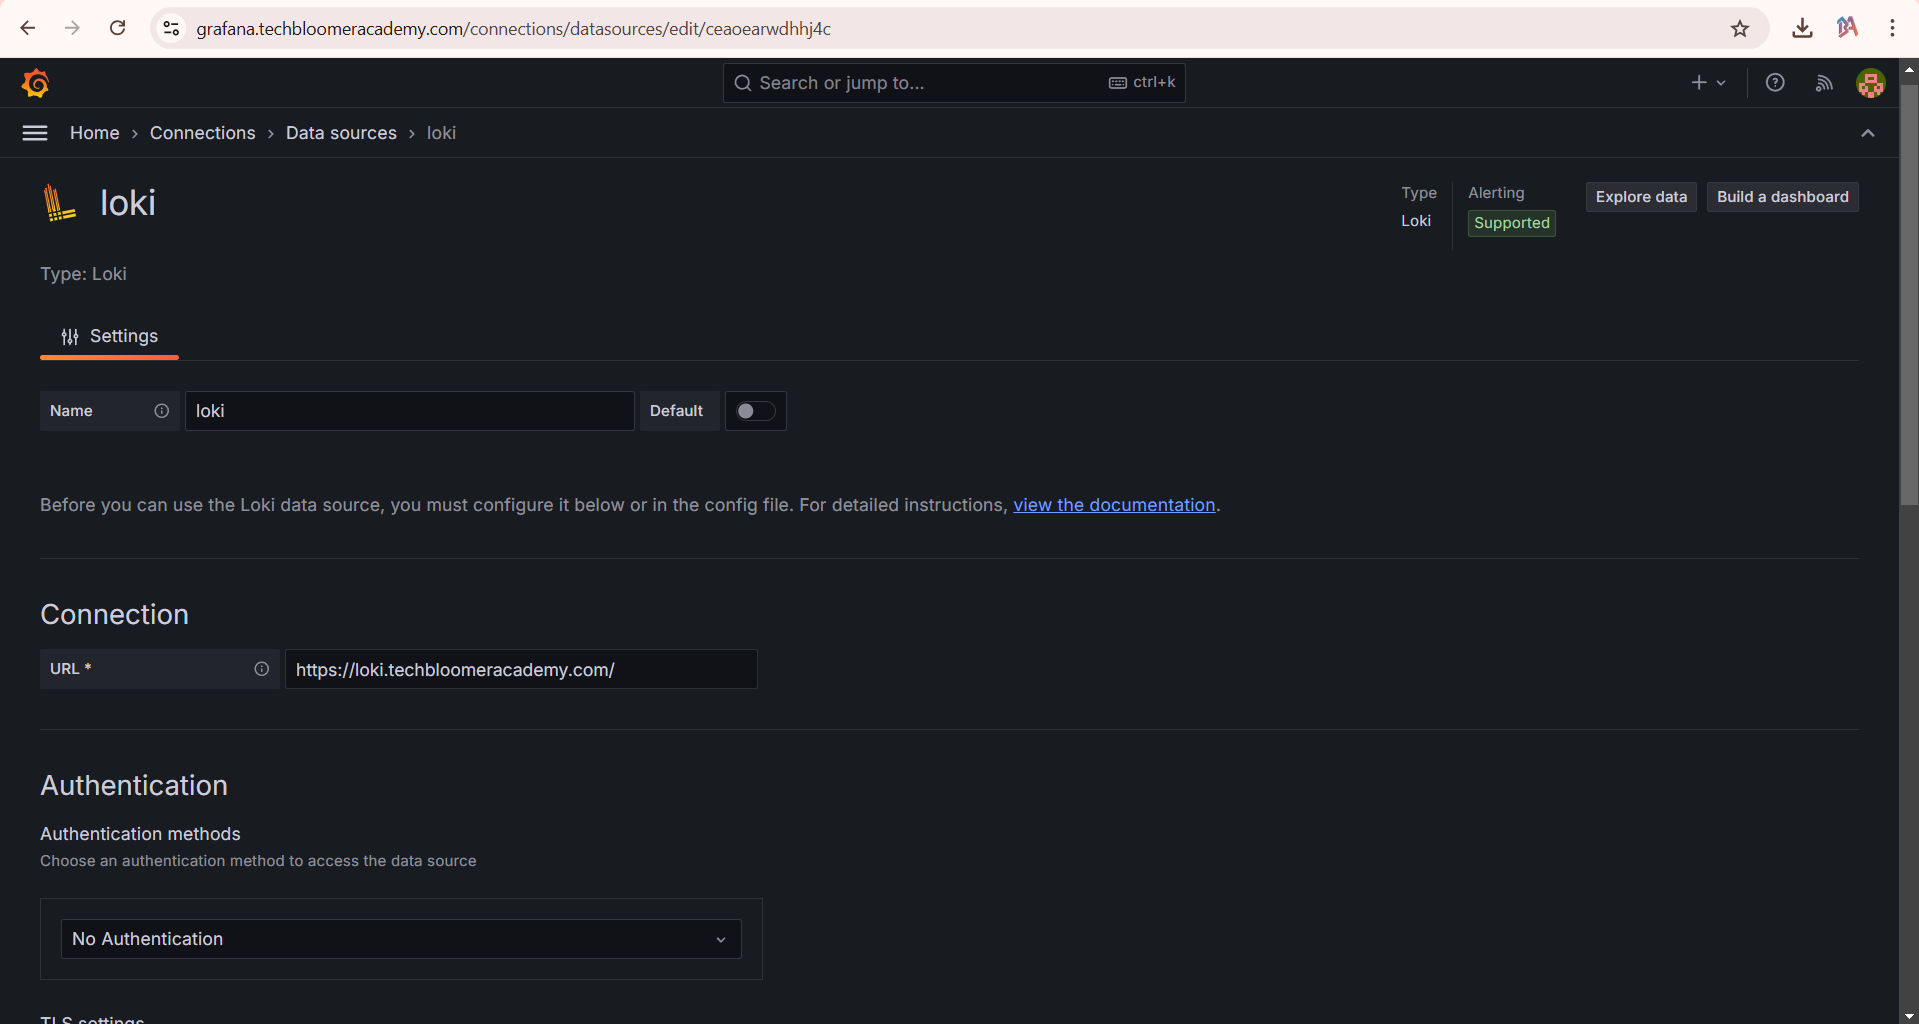
Our Loki instance is available on https://loki.techbloomeracademy.com, but in your environment, it can be simply the IP address, followed by the port (default: 3000).
1. Login to Grafana
- Open your Grafana instance (e.g.,
http://localhost:3000). - Enter your username and password to log in.
2. Navigate to Add a New Connection
- In the left-hand sidebar, click on Home.
- Navigate to Connections → Add new connection.
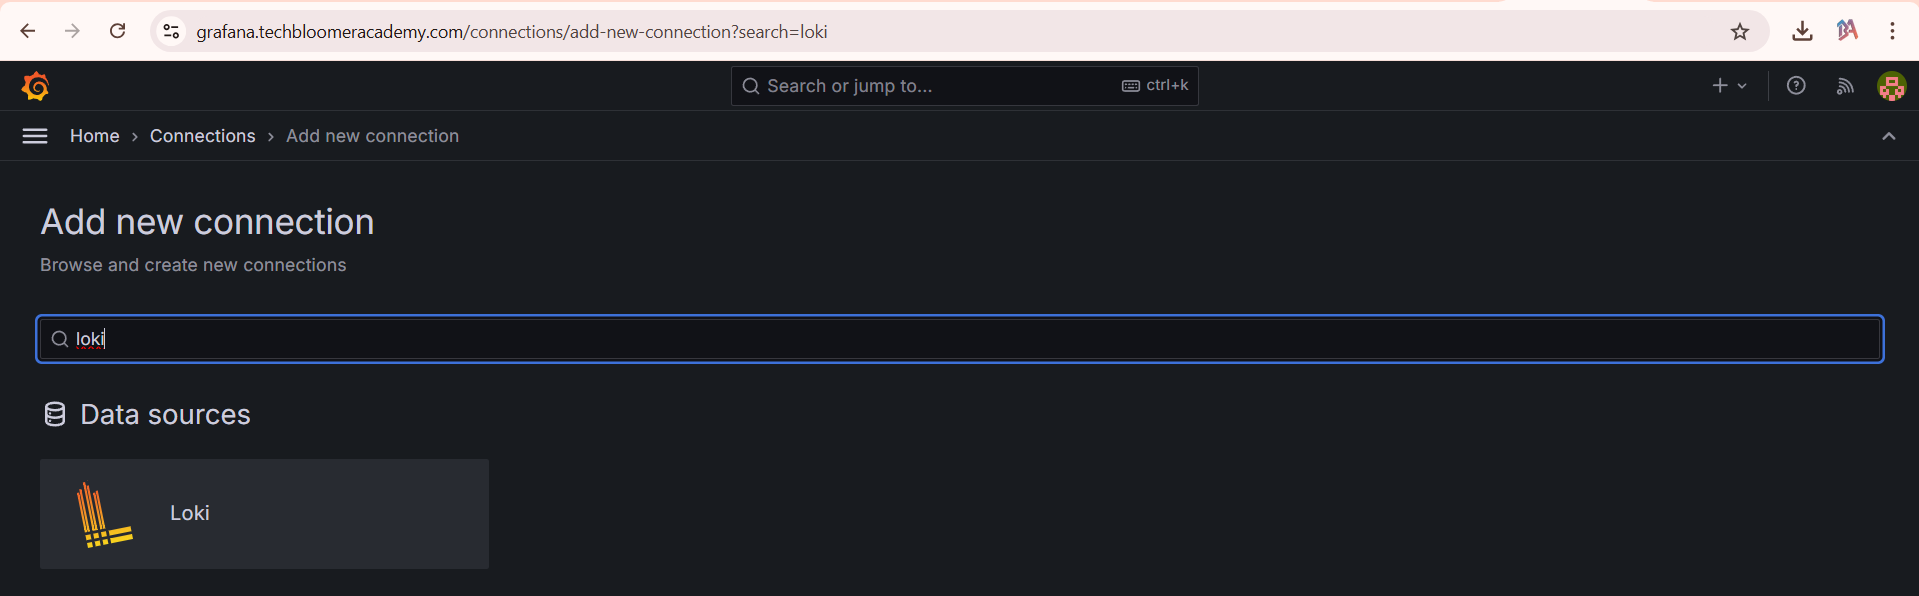
3. Search for Loki
- In the search bar, type Loki to find the Loki datasource.
- Click on Loki to select it.
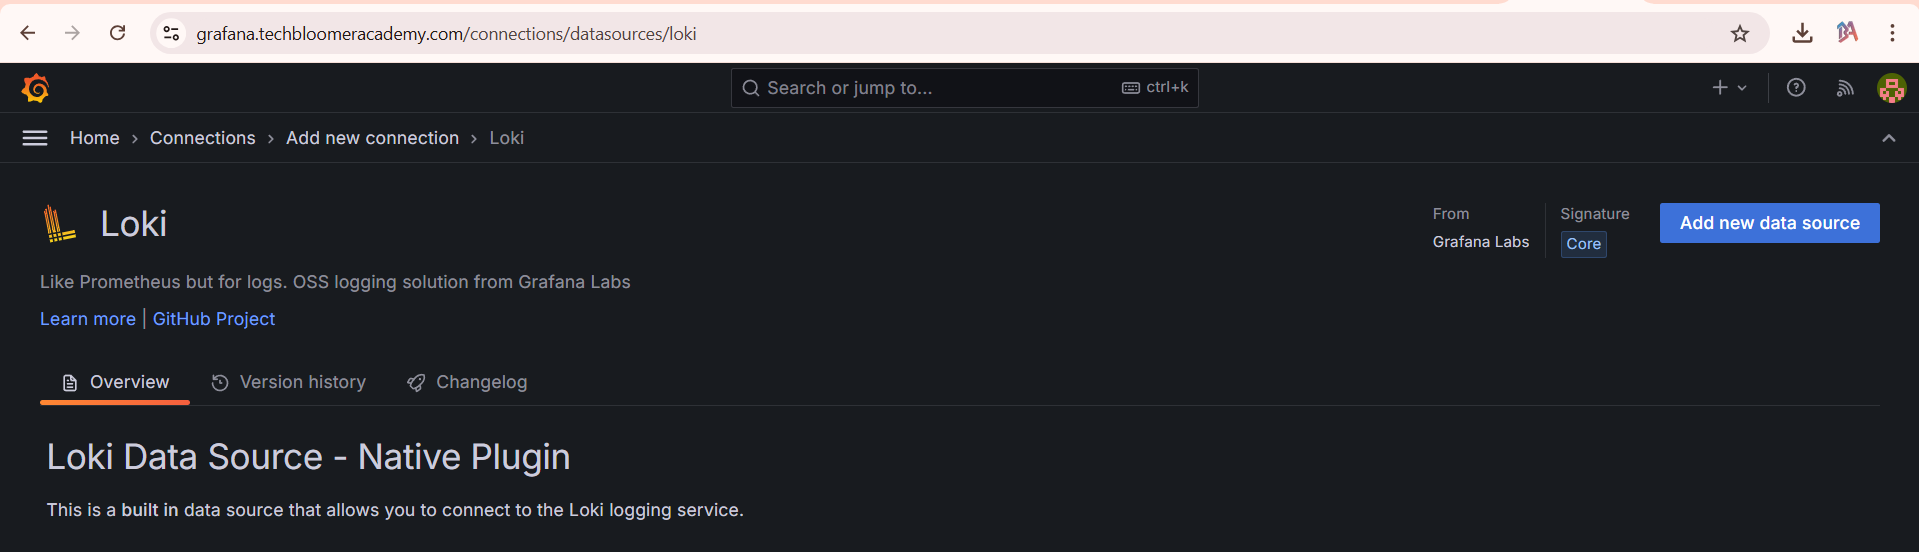
4. Add the Loki Datasource
- Click on the Add new datasource button to proceed.
5. Configure the Loki Datasource
- In the datasource settings, provide the URL of your Loki server (e.g.,
http://<loki-server>:<port>).
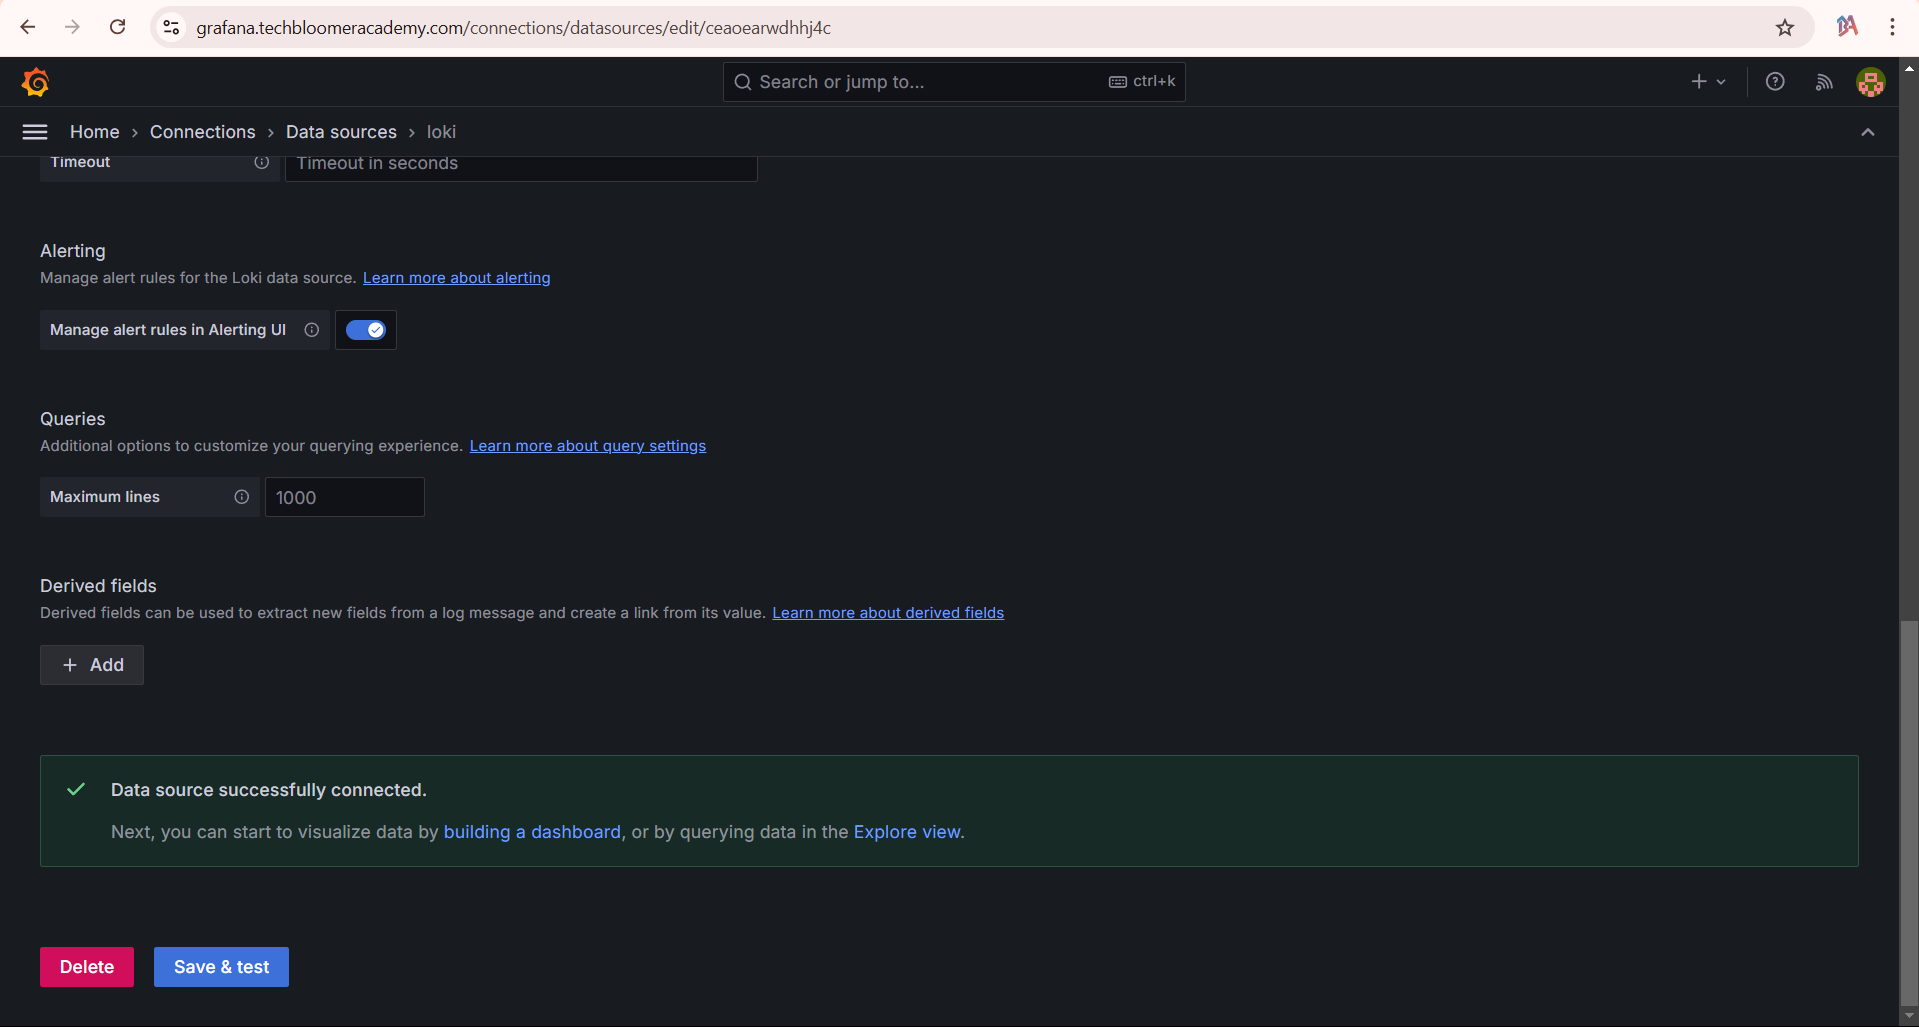
6. Save and Test
- Scroll to the bottom of the page and click Save & Test.
- Grafana will verify the connection to Loki and confirm if it’s working.
Troubleshooting
If you encounter issues while connecting Grafana to Loki, try the following:
-
Verify Loki Server Accessibility: Ensure that the Loki server is running and accessible from the Grafana server.
- Use
telnetorcurlto test connectivity:Or:telnet <loki-server> 3000If these commands fail, check your Loki server configuration or firewall settings.curl http://<loki-server>:3000/metrics
- Use
-
Check Grafana Logs: Review Grafana logs for detailed error messages. Logs can provide insights into issues like incorrect credentials or connection failures.
sudo journalctl -u grafana-server -
Authentication Issues: If your Loki setup uses authentication (e.g., API tokens, Basic Auth):
- Double-check that the credentials are correctly configured in the Grafana Loki datasource settings.
- Ensure you have assigned appropriate permissions to the API token.
-
Firewall or Network Rules: Verify that no firewall or network restrictions are blocking communication between the Grafana and Loki servers.
-
Check Loki's Status: Confirm that Loki is running correctly and not in a failed state:
systemctl status lokiOr review Loki logs for errors:
journalctl -u loki -
Grafana and Loki Versions: Ensure that both Grafana and Loki are compatible. Mismatched versions might cause issues. Check the Grafana Loki compatibility matrix for reference.
-
TLS/SSL Configuration: If you're using HTTPS for Loki:
- Verify that the SSL certificate is correctly configured and trusted by Grafana.
- If necessary, enable the "Skip TLS Verify" option in the Loki datasource settings for testing purposes.
-
Check Proxy Settings: If Grafana connects to Loki through a proxy, ensure the proxy configuration is correct and not blocking requests.
-
Datasource Configuration: Ensure the datasource URL in Grafana matches the actual Loki endpoint, including the protocol (e.g.,
http://orhttps://). -
Loki Query Timeout: Increase the timeout settings in the Loki datasource configuration if you encounter timeouts during queries.
If the issue persists, consult the Grafana and Loki documentation or seek help from the Grafana Community Forum.